In briefWhat is drawdown in forex? It is the decline from an earlier account peak to a later low, measured in money or as a percentage of that peak. Balance drawdown uses closed results, while equity drawdown also reflects open profit and loss. Maximum drawdown is the largest peak-to-trough decline in the period being analysed. Report the measurement basis and dates, because the same trade history can look very different when open losses, deposits, withdrawals or a short sample are ignored.
What is drawdown in forex? Measure from peak to trough
What is drawdown in forex? It is the decline from an earlier account peak to a later low, measured in money or as a percentage of that peak. Balance drawdown uses closed results, while equity drawdown also reflects open profit and loss. Maximum drawdown is the largest peak-to-trough decline in the period being analysed. Report the measurement basis and dates, because the same trade history can look very different when open losses, deposits, withdrawals or a short sample are ignored.
In practice, drawdown tells you how far an account fell before it recovered or stopped falling. That makes it more informative than profit alone. Two traders can both end a month higher, yet the one who endured a much deeper equity drop has taken more stress and more risk along the way.
The term is used across spot FX, rolling spot FX, CFDs and futures, but the account mechanics can differ. For example, a CFD or spot rolling account may show unrealised open losses in equity in real time, while a futures statement often separates realised and unrealised changes through the exchange and clearing system. The concept remains the same: measure the decline from a peak to a trough, then state clearly what was included.
If you are still getting comfortable with the basic building blocks of account risk, start with forex risk management before judging any drawdown figure.
Open exposure is also closely linked to what is margin in forex, because margin pressure can make a drawdown feel much more urgent than a closed-trade report suggests.
Balance, equity and maximum drawdown: what each measure captures
The most common mistake is to treat all drawdown figures as interchangeable. They are not. A closed-trade statement may show only balance drawdown, while a live account can be under greater stress because floating losses have reduced equity even though the balance has not yet changed.
Maximum drawdown is a summary of the worst decline in the chosen period. It is useful, but only when you know whether the period is one week, one year, or the full account history. A small sample can understate the true range of outcomes, while an unusually long and favourable period can make a strategy look smoother than it really is.
Absolute drawdown is another term you may encounter. In broad terms, it refers to the difference between the initial deposit and the lowest point reached below that starting level. Relative drawdown compares the decline with the current peak or account value. Different platforms and reports may define the labels slightly differently, so reading the methodology matters as much as reading the number.
| Measure | What it uses | What it tells you | Main limitation |
|---|---|---|---|
| Balance drawdown | Closed trades only | How far realised results fell from a prior balance peak | Can miss large open losses |
| Equity drawdown | Closed trades plus open profit and loss | The live pain point an account experiences before positions are closed | Moves every tick, so it can look noisy |
| Maximum drawdown | Worst peak-to-trough decline over a defined period | The deepest historical fall in the sample | Depends heavily on the time window chosen |
| Drawdown duration | Time spent below a prior peak | How long capital stayed underwater | A deep but brief fall may feel different from a shallow, prolonged one |
| Recovery time | Time from trough back to a new high | How quickly the account regained lost ground | May never occur in a live strategy that is stopped early |
How to calculate forex drawdown consistently
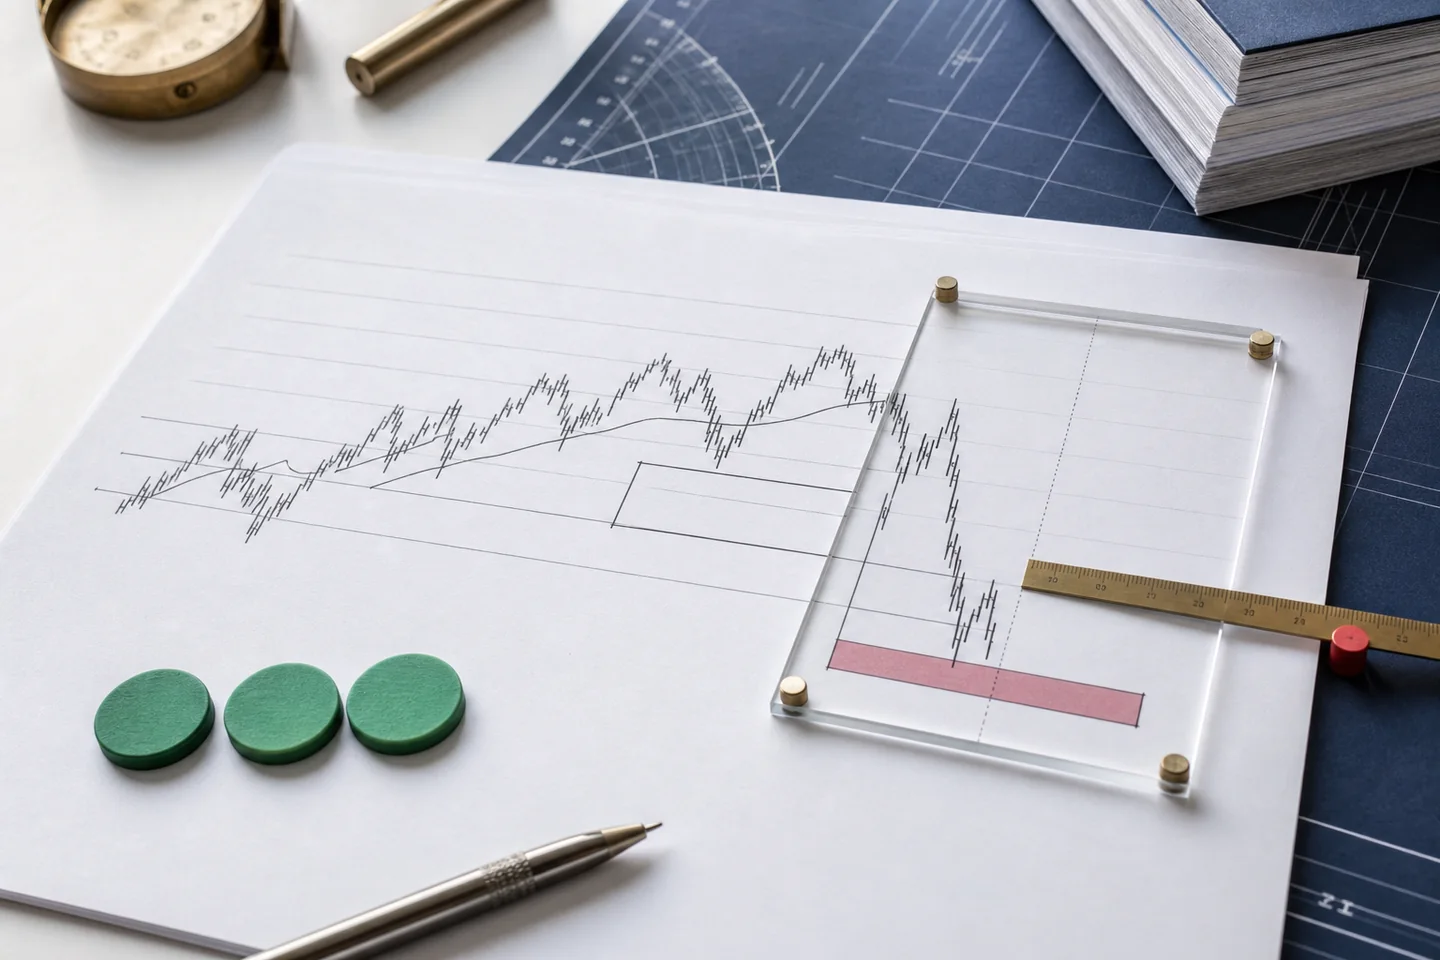
A consistent method is essential. Start with a clearly defined peak in equity or balance, then identify the lowest point that follows before a new high appears. The drawdown percentage is the fall divided by the peak, multiplied by 100. In money terms, it is the absolute difference between those two points.
For example, if an account reaches £12,000 and later falls to £9,600, the drawdown is £2,400. The drawdown percentage is 20% because £2,400 divided by £12,000 equals 0.20. If the account later recovers to £12,000 or higher, the drawdown has ended, but the time taken to recover still matters.
The calculation sounds simple, but the measurement window is where many reports go wrong. If a trader adds capital midway through the period, or withdraws profits after a winning run, the raw account balance can change without any trading loss. That is why you should compare like with like and note whether the figure is based on account equity, balance, or a platform report with its own assumptions.
How a drawdown is identified in sequence
Mark the highest account value before the decline begins.
Track the fall as price moves against open positions or as losses are realised.
Record the lowest point reached before a fresh high appears.
Note when the account recovers above the previous peak.
Why the recovery percentage is larger than the loss percentage
The loss is 20%, but the recovery needed from £9,600 back to £12,000 is 25%.
Drawdown recovery: the mathematics of getting back to breakeven
Recovery is not symmetrical. A 10% fall does not need a 10% rise to recover; it needs an 11.1% rise. That gap widens quickly as the loss deepens. This is why traders who let losses expand often find the account much harder to restore than they expected.
The relationship matters because the remaining capital becomes the new base. After a loss, every percentage gain is applied to a smaller amount. That means the later stages of recovery can demand more time, more consistency, or both. It also means that a strategy with frequent deep drawdowns can suffer even if it occasionally posts a strong winning burst.
The table below shows the size of the rebound needed after common illustrative losses. These figures are arithmetic, not predictions. They are still useful because they show why protecting capital early is usually easier than repairing it later.
For a broader view of whether an account trajectory is realistic, it can help to read is forex trading profitable alongside drawdown figures rather than in isolation.
| Illustrative loss | Capital remaining | Gain needed to recover | Why it matters |
|---|---|---|---|
| 5% | 95% | 5.3% | A small loss is relatively easy to repair if trading conditions remain stable |
| 10% | 90% | 11.1% | The recovery target is already greater than the original loss |
| 20% | 80% | 25% | The rebound requirement becomes noticeably harder to achieve |
| 30% | 70% | 42.9% | A moderate setback can consume a long run of gains |
| 50% | 50% | 100% | The account must double just to return to breakeven |
Why drawdown matters for leverage, size and staying power
Drawdown is not just a performance statistic; it is a survival statistic. A trader who uses too much leverage can experience a drawdown that is large enough to trigger stop-outs, reduce margin headroom or force a premature exit. The more leveraged the position, the less room there is for normal price noise before losses become difficult to manage.
Position size also affects the shape of the curve. If two traders take the same market view but one uses a smaller lot size, the resulting drawdown percentage may be materially different even if both were wrong for the same reason. This is why drawdown analysis belongs alongside position sizing, order placement and capital allocation.
In regulated and institutional contexts, risk teams often focus on drawdown duration as well as depth. A strategy that recovers quickly may be easier to run than one that spends weeks below its previous peak. In spot FX and CFDs, where financing, spreads and execution costs can all erode returns, a longer underwater period can be especially expensive even when the nominal drawdown looks modest.
If leverage is part of the picture, revisit what is leverage in forex so you can connect account movement with exposure.
Execution costs also influence the path of recovery, so it is worth understanding what is a forex spread and what does it cost before assuming a small edge will survive repeated drawdowns.
A simple review routine for forex drawdown analysis
A practical review routine should answer four questions: how deep was the decline, how long did it last, what caused it, and how was it managed? Start by separating balance drawdown from equity drawdown, then check whether any deposits or withdrawals distorted the account curve. Without that separation, the numbers may be mathematically correct but commercially misleading.
Next, compare the worst drawdown with the trade context. Was the account hit by one unusually large position, a run of correlated losses, or repeated attempts to fade a trend? The answer matters because a drawdown caused by random noise is different from one caused by a structural flaw in the strategy.
Finally, check whether the report comes from a demo account, a live account, or a backtest. Demo and historical results can be useful for process testing, but they do not capture every live-market variable. If you need a refresher on the practical difference, see
The aim is not to avoid all drawdown. That is unrealistic. The aim is to understand how much decline is tolerable for your method, capital base and time horizon, and to stop confusing a recoverable fluctuation with a breakdown in the trading process.
demo vs live trading account because platform conditions and emotional pressure can make the same strategy behave differently.
From shallow to severe drawdown
How platform reports can change the drawdown story
Different platforms can present history in different ways. A MetaTrader report, for example, separates balance and equity lines in the history and account reports, which can help distinguish realised results from open exposure. That distinction is valuable because a sharp equity drop can disappear from a closed-trade summary once the position is later closed at a better level.
This matters in FX because market movement can be continuous and leveraged. A small adverse move on a large position can temporarily create a much larger equity drawdown than the final trade result suggests. If you only inspect closed trades, you may miss the risk profile that was actually present during the holding period.
Institutional instruments can add further complexity. Futures statements typically reflect exchange-traded positions and margining, while OTC spot and rolling spot FX accounts depend on the broker's pricing, execution and financing structure. The same phrase, 'drawdown', may therefore describe very different reporting environments, even though the underlying idea remains identical.
If you want to understand how exposure can move quickly against a position, read what is liquidity in forex because thin conditions can make account swings feel larger.
Frequently asked questions about drawdown in forex
What is drawdown in forex in plain English?
What is drawdown in forex? It is the fall from a prior account high to a later low. Traders usually express it as a money amount or as a percentage of the peak. If the account later makes a new high, the drawdown period is over.
Is equity drawdown more important than balance drawdown?
Often, yes, because equity drawdown includes open profit and loss, so it shows the pressure on the account before positions are closed. Balance drawdown is still useful, but it can miss risk that was present during the trade.
What is maximum drawdown and why do people focus on it?
Maximum drawdown is the worst peak-to-trough decline in a chosen period. It is popular because it gives a single stress measure, but it should always be read with the time window, the account type and the reporting basis.
How much recovery is needed after a drawdown?
It depends on the size of the loss. A 10% drawdown needs an 11.1% gain to recover, while a 50% drawdown needs a 100% gain. The larger the loss, the harder the recovery becomes.
Does a shorter drawdown duration make a strategy better?
Not automatically, but shorter drawdown duration can indicate that capital spends less time underwater. That can matter for patience, risk control and opportunity cost, especially if you trade actively.
Should I use drawdown alone to judge a forex strategy?
No. Drawdown is important, but it should sit alongside costs, leverage, trade frequency, liquidity conditions, and whether the results came from spot FX, rolling spot FX, CFDs or futures. A single metric rarely tells the whole story.